ADVERTISEMENT

All Decade Team

dukedevilz

Well-Known Member
Apr 3, 2002
11,533
15,328
113
all-deade-team.jpg

all-decade-team1.jpg

all-deacde-team2.jpg


First of all, you're welcome.

Second, I'm sure you might be wondering how the scoring is calculated:

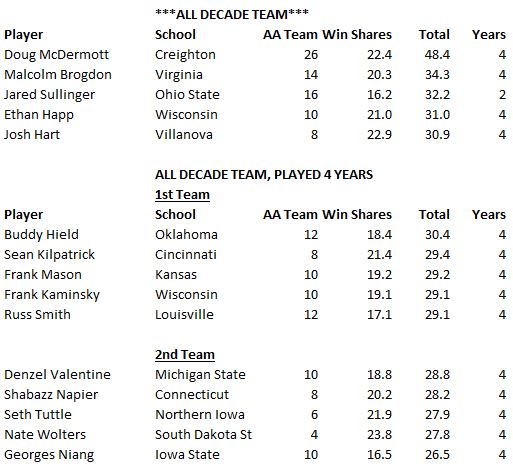
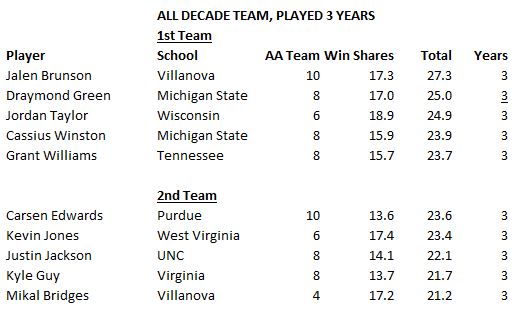
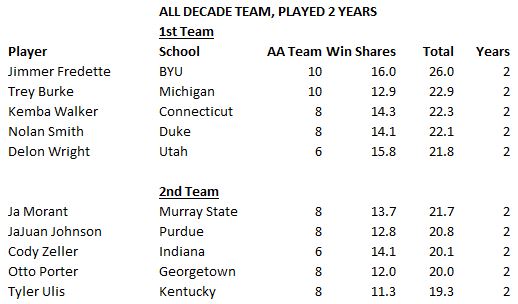
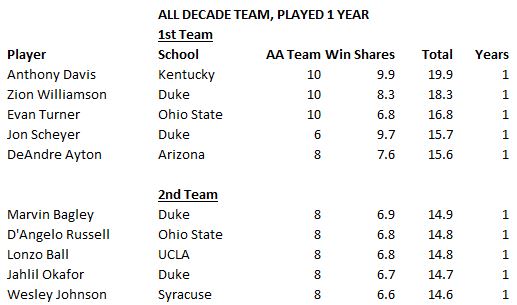
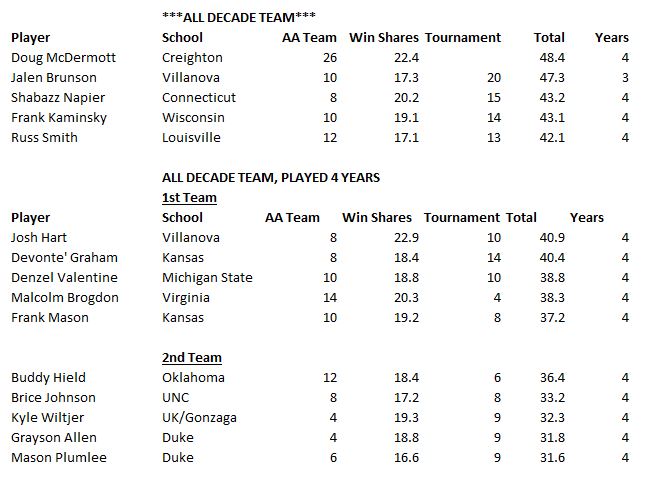
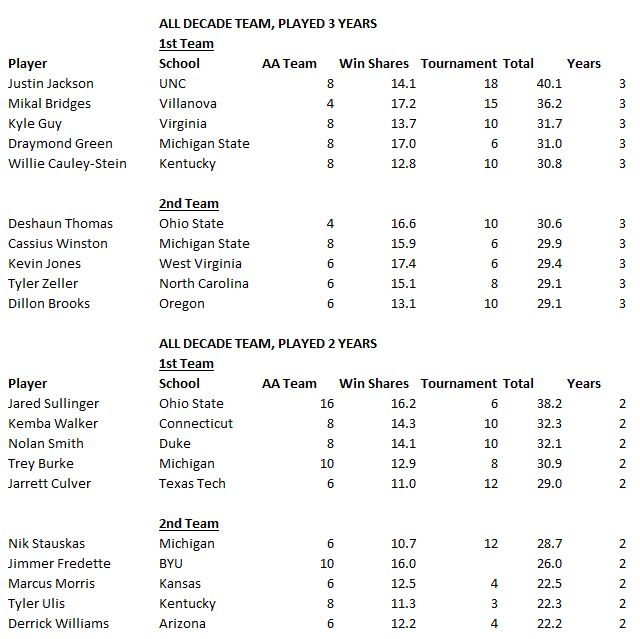
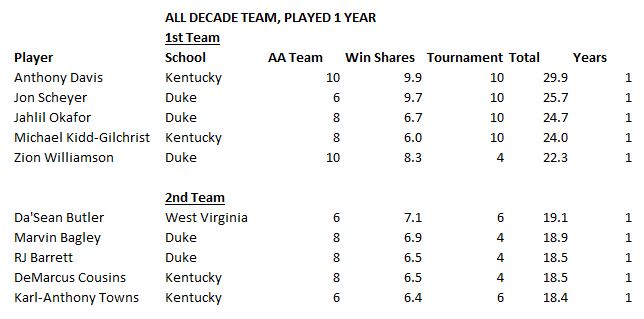
-AA= All American Team. (10 for AP NPOY, 8 for 1st Team, 6 for 2nd Team, and 4 for 3rd Team). Doug McDermott had the highest point total of all players simply due to being a 3-time 1st Team All-American.

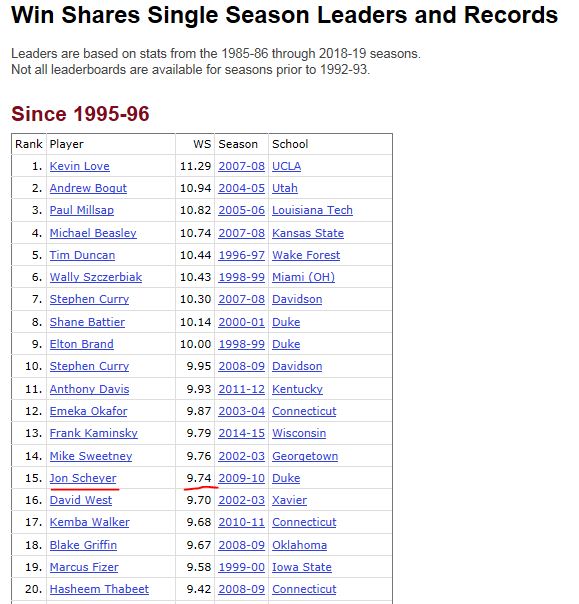
-Win Shares is pretty clear. Just based on the total number of Win Shares that a player produced

-Tournament points: 10 points for NCAA Champs, 8 for Runners-up, 6 for Final Four, 4 for Elite 8. If player did not start on a particular team, they only receive half of those points (ie Luke Maye in '17, Mikal Bridges in '16, and Grayson Allen in '15)

-If a player is near the top of all 3 categories, you can expect his numbers to be around 10 for one specific season (see Anthony Davis in 2012). That was the basis for my scoring system. Technically, I could have added on more points like AP Honorable Mention All American + tournament wins in round 1/2. But I felt like that wouldn't have significantly altered the overall numbers. I saw it as diminishing returns.

-In order to qualify for scoring, players had to make one of the 3 AP All-American Teams. I totaled all 1st Team selections. After that, 2nd or 3rd Team calculations were included if they were an All-American more than once, or if they played in at least 1 Regional Final.
 
Last edited:
Interesting list. I probably would have gone with freshmen beginning in 09-10 though. Scheyer with all the elite OADs just looks weird.
 
Marcus Morris was a 3 year player, FYI.

Nice list though.

Edit - Unless you’re just counting 2010 and 2011 for the decade. My mistake.

It's based off on how many years of college basketball they played this decade.

Interesting list. I probably would have gone with freshmen beginning in 09-10 though. Scheyer with all the elite OADs just looks weird.

He's got company with Da'Sean Butler, however. But yes, it does look a little strange. At first, I was simply only going to have the top 15 players, regardless. But it seems odd not to have someone like Anthony Davis or Zion on there. They were so dominant. I thought the most sensible way to reconcile this way to break down the players by the numbers of years they played this decade.
 
Not sure how Thomas Robinson of KU was left off a list.

He was really close to making it on the 3-year team, actually.

All-American Points: 8 (2012 1st Team All-American)
Win Shares: 10.6
Tournament: Reserve on the 2011 Elite 8 team (2 points) + Starter on 2012 Runner-up team (8 points) = 10 points

8+10.6+10 = 28.6

Tyler Zeller and Dillon Brooks rounded out the top 10 with a score of 29.1
 
Not a bad list at all.

If I was going to be nit-picky, I would argue that it hinges a bit too much on team success though. For instance, I'd take Wall, Cousins or KAT over MKG in college if I was picking a team. MKG just happened to be on the better team. I also wouldn't have Scheyer on the one year squad, because....duh. Seems like a decent model overall.

I'd be interested to see how the data changes if you only look at 1st and 2nd team All-Americans.
 
Last edited:
  • Like
Reactions: dukedevilz
Not a bad list at all.

If I was going to be nit-picky, I would argue that it hinges a bit too much on team success though. For instance, I'd take Wall, Cousins or KAT over MKG in college if I was picking a team. MKG just happened to be on the better team. I also wouldn't have Scheyer on the on and done list, because....duh. Seems like a decent model overall.

Actually, looks like I miscalculated on MKG. He was 3rd Team, and for some reason I listed him as a 1st Teamer. That would bring his score down to 20.0. I'm curious to see what the numbers look like if I take tournament status out of the equation altogether.
 
  • Like
Reactions: Global Havok
Honestly, it's impossible not to have Jon Scheyer on this list. A big component of my calculation is Win Shares - and only Anthony Davis and Frank Kaminsky had more Win Shares in a single season this decade.

scheyer.jpg
 
  • Like
Reactions: Mac9192
He was so smart. Doesn’t get enough credit, probably because he wasn’t flashy, but he just knew how to play the game.
Agreed. Him and his back court mate Nolan Smith both. When Scheyer moved from the wing positions to the point, it made that team really efficient and one of the reasons they were national champs. Such a fun team to watch.
 
But with the eye test, John Wall much superior than Scheyer at pt.

Nobody is arguing about the eye test. John Wall was a 1st Team All-American; Scheyer was 2nd Team. But I think you could argue that Scheyer had a more effective season in 2010. Scheyer had an assist/turnover ratio of 3 to 1, meanwhile Wall was at 1.5. If you look at the D1 leaders in 2019, an Ast/TO ratio of 1.5 wouldn't even be in the top 200 (Scheyer would be in the top 10). Scheyer also had a slightly higher true shooting percentage - and he was off the charts in the win shares category. Duke and Kentucky both had 35 wins on the season; Scheyer is credited with 9.7 win shares, whereas John Wall had 6.3.
 
Nobody is arguing about the eye test. John Wall was a 1st Team All-American; Scheyer was 2nd Team. But I think you could argue that Scheyer had a more effective season in 2010. Scheyer had an assist/turnover ratio of 3 to 1, meanwhile Wall was at 1.5. If you look at the D1 leaders in 2019, an Ast/TO ratio of 1.5 wouldn't even be in the top 200 (Scheyer would be in the top 10). Scheyer also had a slightly higher true shooting percentage - and he was off the charts in the win shares category. Duke and Kentucky both had 35 wins on the season; Scheyer is credited with 9.7 win shares, whereas John Wall had 6.3.
You forgot to add that one of them is a winner and the other is not.
 
True statement! Wall has never even been a part of a team that was among the final four teams left - at the collegiate or professional level.
Granted Cousins was on the Warriors last year, but he was teammates with Wall @ UK. Wall was the best player on that UK team.

Edit: It's your list/game, and I don't care who you left off or on your list. I was just saying. Anyway, nice thread.
 
Nobody is arguing about the eye test. John Wall was a 1st Team All-American; Scheyer was 2nd Team. But I think you could argue that Scheyer had a more effective season in 2010. Scheyer had an assist/turnover ratio of 3 to 1, meanwhile Wall was at 1.5. If you look at the D1 leaders in 2019, an Ast/TO ratio of 1.5 wouldn't even be in the top 200 (Scheyer would be in the top 10). Scheyer also had a slightly higher true shooting percentage - and he was off the charts in the win shares category. Duke and Kentucky both had 35 wins on the season; Scheyer is credited with 9.7 win shares, whereas John Wall had 6.3.

How are win shares calculated? Because comparing win shares for Michigan players over the years it looks like a pretty awful stat. Pretty sure Mo Wagner had more defensive wins shares in 2018 than Big Ten Defensive Player of the Year Jaren Jackson. Wagner was an average or slightly below average defender.
 
  • Like
Reactions: lurkeraspect84
How are win shares calculated? Because comparing win shares for Michigan players over the years it looks like a pretty awful stat. Pretty sure Mo Wagner had more defensive wins shares in 2018 than Big Ten Defensive Player of the Year Jaren Jackson. Wagner was an average or slightly below average defender.

Wagner played more games and averaged more minutes. Not exactly comparable. Plus, most of the Win Shares are made up on the offensive end. Very few players have a significant number in the defensive win share column. FWIW, JJJ had a much higher WS/40 minutes (.239) than Wagner (.213). He'd have more defensive WS if they played the same number of overall minutes. But, here is the forumla as explained on sports-reference:

III. Crediting Offensive Win Shares to Players
A. 2009-10 to present

Offensive Win Shares are credited to players based on Dean Oliver's points produced and offensive possessions. The process for crediting Offensive Win Shares is outlined below (using Jared Sullinger of the 2011-12 Ohio State Buckeyes as an example):

  1. Calculate points produced for each player. In 2011-12, Sullinger had an estimated 609.7 points produced.
  2. Calculate offensive possessions for each player. Sullinger had an estimated 500.3 offensive possessions in 2011-12.
  3. Calculate marginal offense for each player. Marginal offense is equal to (points produced) - 0.875 * (division points per possession) * (offensive possessions). For Sullinger this is 609.7 - 0.875 * 1.0170 * 500.3 = 164.5. Note that this formula may produce a negative result for some players.
  4. Calculate marginal points per win. Marginal points per win reduces to 0.5 * (division points per game) * ((team pace) / (division pace)). For the 2011-12
  1. IV. Crediting Defensive Win Shares to Players
  2. A. 2009-10 to present
    Crediting Defensive Win Shares to players is based on Dean Oliver's Defensive Rating, which is an estimate of the player's points allowed per 100 defensive possessions. Here is a description of the process (once again using Sullinger in 2011-12 as an example):
    1. Calculate the Defensive Rating for each player. Sullinger's Defensive Rating in 2008-09 was 85.8.
    2. Calculate marginal defense for each player. Marginal defense is equal to (player minutes played / team minutes played) * (team defensive possessions) * (1.125 * (division points per possession) - ((Defensive Rating) / 100)). For Sullinger this is (1123 / 7800) * 2550 * ((1.125 * 1.017) - (85.8 / 100)) = 105.0. Note that this formula may produce a negative result for some players.
    3. Calculate marginal points per win. Marginal points per win reduces to 0.5 * (division points per game) * ((team pace) / (division pace)). For the 2011-12 Buckeyes this is 0.5 * 68.0 * (67.0 / 66.3) = 34.36.
    4. Credit Defensive Win Shares to the players. Defensive Win Shares are credited using the following formula: (marginal defense) / (marginal points per win). Sullinger gets credit for 105.0 / 34.36 = 3.1 Defensive Win Shares.
    2 Buckeyes this is 0.5 * 68.0 * (67.0 / 66.3) = 34.36.
  3. Credit Offensive Win Shares to the players. Offensive Win Shares are credited using the following formula: (marginal offense) / (marginal points per win). Sullinger gets credit for 164.5 / 34.36 = 4.8 Offensive Win Shares.
 
Nobody is arguing about the eye test. John Wall was a 1st Team All-American; Scheyer was 2nd Team. But I think you could argue that Scheyer had a more effective season in 2010. Scheyer had an assist/turnover ratio of 3 to 1, meanwhile Wall was at 1.5. If you look at the D1 leaders in 2019, an Ast/TO ratio of 1.5 wouldn't even be in the top 200 (Scheyer would be in the top 10). Scheyer also had a slightly higher true shooting percentage - and he was off the charts in the win shares category. Duke and Kentucky both had 35 wins on the season; Scheyer is credited with 9.7 win shares, whereas John Wall had 6.3.

I don't disagree with the stats... just the eye test lol.... Scheyer was a great collegiate player.
 
Confused to how you used the ‘years’

I'm only accounting for years played during the decade. So, Draymond Green, for example, is counted as a 3-year player in this stat because his freshmen year was the 2008-09 season. Jon Scheyer is a one-year player because his senior year was 2009-10. His other three seasons were in a prior decade.
 
  • Like
Reactions: Quavarius
ADVERTISEMENT